Reports
This is new page in Job Lists that now houses the previous Jobsite pages:
Staffing Reports
Audits
Budget Variance
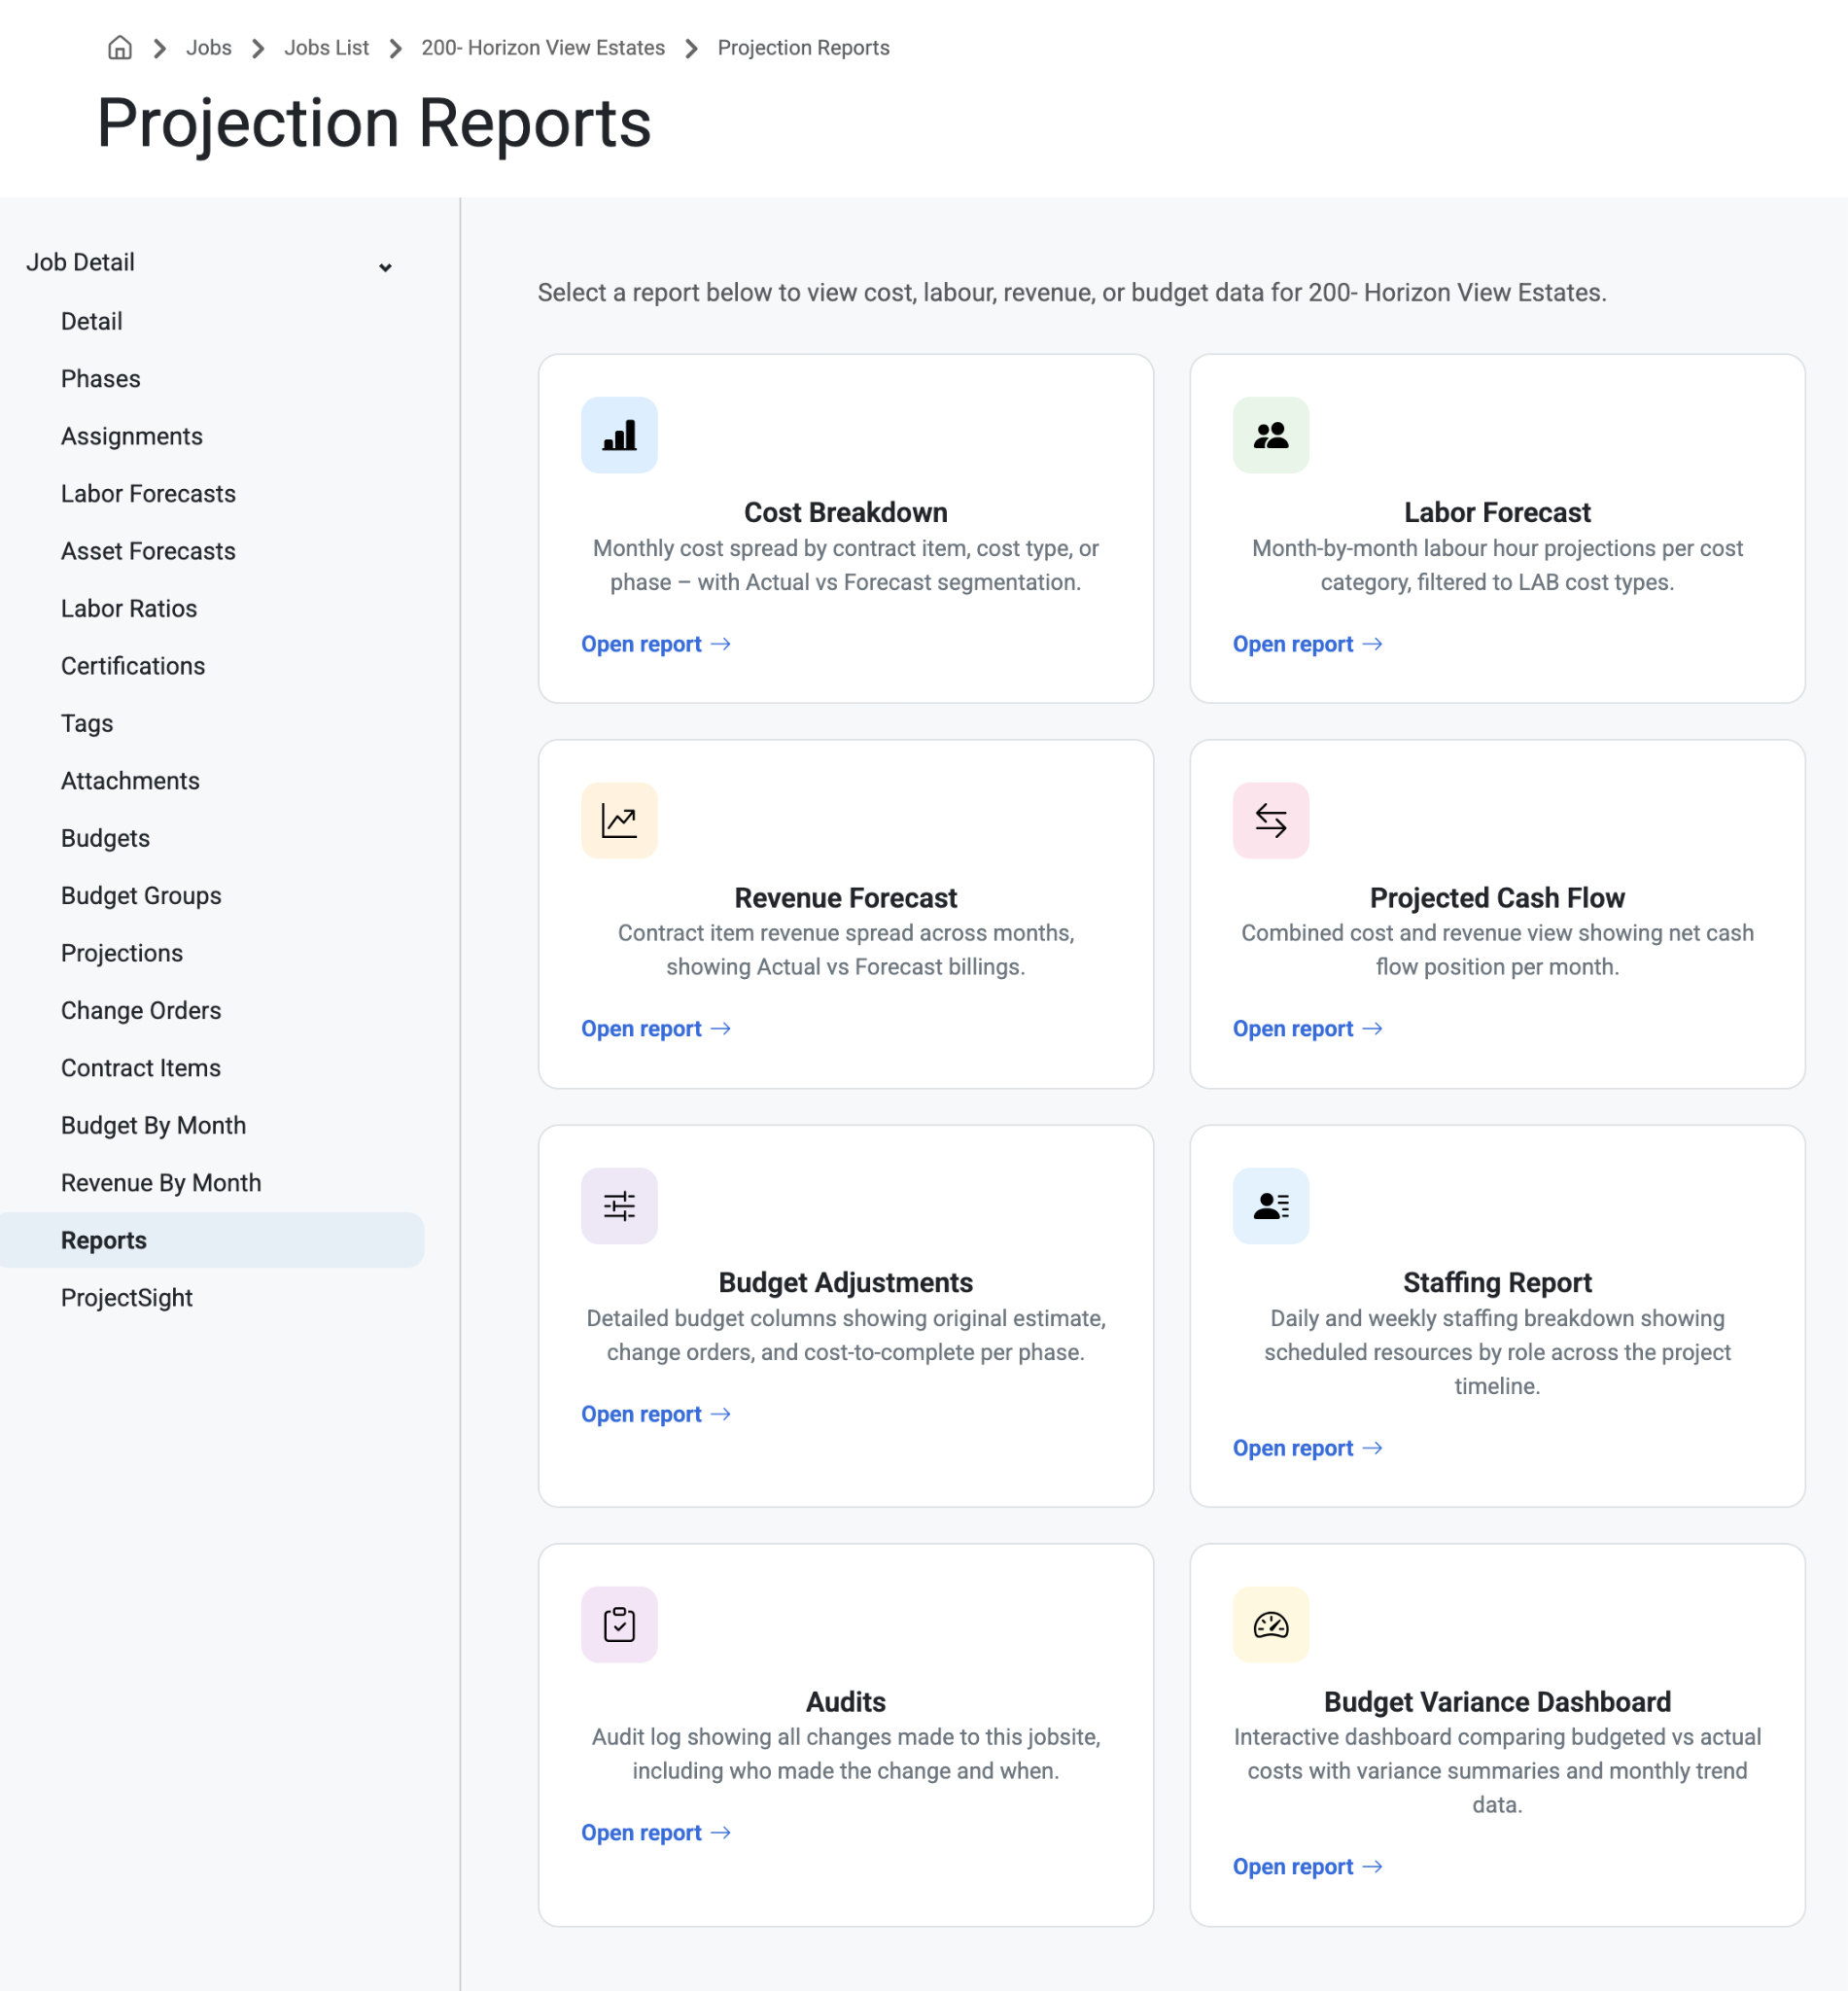
The Reports Page also now has information on Cost, Labour, Revenue, and Budget data organized into the following categories:
Cost Breakdown
Labor Forecasts
Revenue Forecast
Projected Cash Flow
Budget Adjustments
Cost Breakdown
This page shows Monthly cost spread by contract item, cost type, or phase with Actual vs. Forecast segmentation
Search a cost breakdown of a projection by month or select ‘Export Excel’ to share.
Labor Forecast
This page shows Month-by-Month labour hour projections per cost category, filtered to LAB cost types.
Search a labor forecast of a projection by month or select ‘Export Excel’ to share.
Revenue Forecast
The page shows Contract item revenue spread across months, showing Actual vs. Forecast billings.
Search a revenue forecast by Start/End month to view a chart that shows the Contract Item and Contract Amount by month.
Select ‘Export Excel’ to share.
Projected Cash Flow
This page shows a Combined cost and revenue view that shows net cash flow position per month.
Search a cash flow by Start/End month to view a chart that shows the Contract Billings Revenue, Total Costs and Net Cash Flow by month.
Select ‘Export Excel’ to share.
Budget Adjustments
This page shows detailed budget columns showing original estimates, change orders, and cost-to-complete per phase.
Select a projection month from the drop down menu or select ‘Export Excel’ to share.
Staffing Report
This page shows a Daily and weekly staffing breakdown showing scheduled resources by role across the project timeline.
Staffing Trends
Filter by Date; Day or Week
Match Rate % - Shows the average staffing accuracy
Forecasted Total - Shows people planned per day
Scheduled Total - Shows scheduled vs forecasted
Actual Total - Shows actual vs scheduled
Detailed Breakdown
Shows Daily staffing with employee assignments.
Date - Click to view the names and number of scheduled employees for that day
Forecasted
Scheduled
Actual
Variance
Shows the difference in the number of planned headcount and actual headcount. Red means the number is in the negative.
Employee Match
Shows the percentage of how many employees were scheduled compared to the actual headcount.
Audits
The Audits page shows all changes made to this jobsite, including who made the change and when. Search, Filter, and Save views.
Most pages throughout Resource Planning have audits to track any changes.
Where Are Audits Used?
Admin>Organization>Notification Settings
Admin>Organization>Business Groups
Admin>Organization>Users
Admin>Organization>Permission Groups
Admin>Job Setup>Phases
Admin>JobSetup>Tags
Admin>JobSetup>Work Schedule
Admin>Employee Setup>Positions
Admin>Employee Setup>Certifications
Admin>Employee Setup> Labor Types
Admin>Asset Setup>Asset Categories
Admin>Crew Setup>Crew Types
Budget Variance Dashboard
This page is only available to those with ‘Can View Sensitive’ permissions.
Learn how to setup or change permissions here: Permissions
This page is an interactive dashboard comparing budget vs actual costs with variance summaries and monthly trend data.
Budget Variance
Search by all or customBudget Group, Phase Code, or Cost Type.
Contract
Original Contract Amount
Current Contract Amount
Estimated Profit
Summary
Profit Margin %
Total Hours
Total Units
Total Cost
Total Revenue
Total Profit
Budget Breakdown by Cost type
Budgeted
Projected
Actual Cost
Trends
Shows Cost vs Revenue
Budget Cost
Contract Amount
Cost to Date
Shows Hours vs Units
Budget and Profits
Shows Budget & Revenue by Month
Budget vs. Revenue
Shows Profit Fade Analysis
Contract Amount vs Actual Cost
Detail View
More Budget Data based on selected filters
Was this article helpful?
That’s Great!
Thank you for your feedback
Sorry! We couldn't be helpful
Thank you for your feedback
Feedback sent
We appreciate your effort and will try to fix the article